Technology > UAVSAR-Ka (GLISTIN-A)
UAVSAR-Ka (GLISTIN-A)
Wavelength = 8 mm
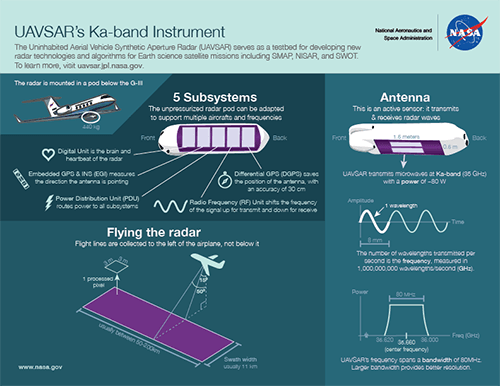
UAVSAR-Ka is a state-of-the-art Ka-band airborne single-pass interferometric SAR designed to map land surface topography. It is part of the UAVSAR instrument suite.
View & download data View science deployments View publications
Science
Instrument
UAVSAR-Ka can be used for a variety of science applications. If you are interested in requesting data, please look into submitting a flight request.
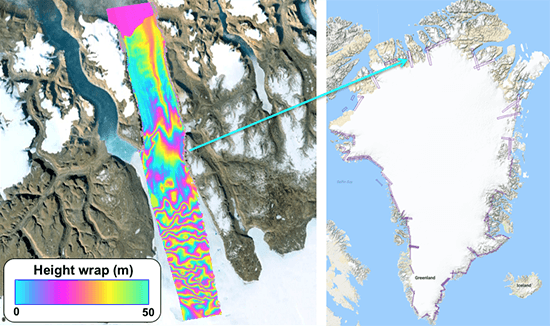
Single-pass interferometry of Ryder Glacier data acquired on March 19, 2018.
Preliminarily calibrated height map displayed in Google Earth.
Land Ice Topography
Observing glacier topography change
UAVSAR-Ka has collected data over glaciers in Alaska and Greenland, enabling scientists to measure glacier elevations and velocities.
It is supporting the Earth Venture Oceans Melting Greenland (OMG) mission to monitor Greenland coastal glacier melting annually from 2016-2019.
When compared to lidar data, UAVSAR-Ka's elevation measurements were shown to meet its height precision requirements.
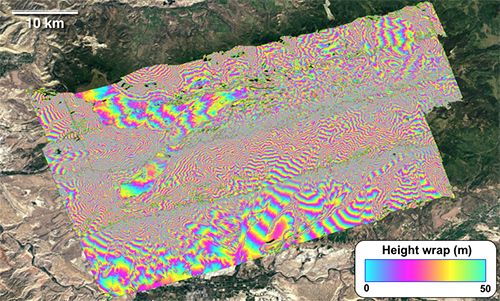
Preliminary topographic mosaic of the SnowEx experiment over Grand Mesa,
Colorado. Data was acquired in February 2017.
Snow Accumulation
Observing seasonal topography change due to snow accumulation
Snow accumulation measurements using summer and winter UAVSAR-Ka passes show promise when compared to JPL's Airborne Snow Observatory (ASO) lidar measurements. Additional work on data filtering and vegetation masking is in progress.
UAVSAR-Ka participated in the SnowEx airborne campaign, collecting snow topography data before and after snowfall.
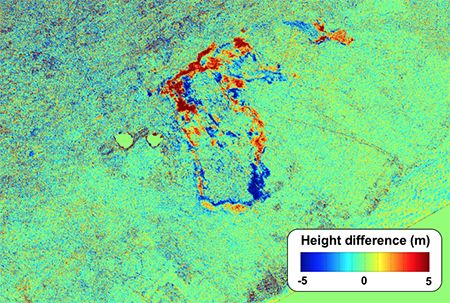
Image of preliminary height differences showing new lava activities in
Leilani Estates from May 18–19, 2018. Orange/red areas = lava growth.
Blue areas = “height loss,” likely due to lava flows toppling trees.
Volcano Dynamics
Observing topography change due to lava flows from volcano eruptions
During the May 2018 Kilauea volcano eruption in Hawaii, UAVSAR-Ka demonstrated the ability to detect topographic changes due to lava flows during an active volcano eruption event.
Additional work is ongoing to extract the lava thickness from the height changes after accounting for tree height changes and measurement noise.
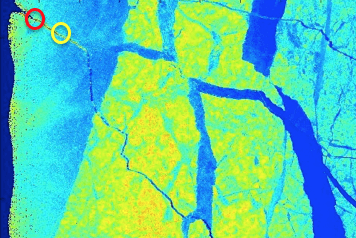
Example of open leads in the height image used to
measure ice thickness.
Sea Ice
Observing sea ice thickness
UAVSAR-Ka has demonstrated the ability to measure sea ice thickness, the difference between the surface height of the sea ice and water in open leads (narrow, linear cracks in the ice).
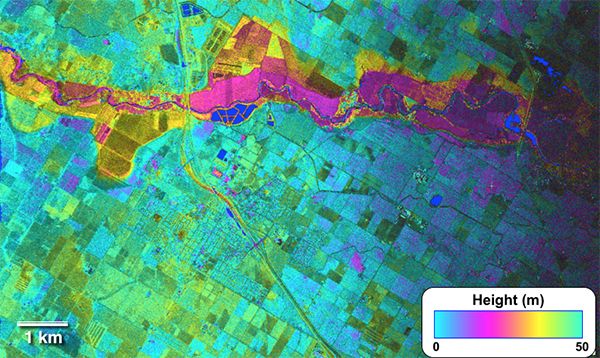
UAVSAR-Ka DEM over a flooded area of California's Central Valley.
Floodplain Mapping
Observing flood inundation
Scientists are investigating the use of UAVSAR-Ka to improve flood forecasting, since its high topographic accuracy and resolution would better drive the models. Flood signatures have been observed in data acquired in the Central Valley and North Dakota.
Future Science Potential
These applications have yet to be demonstrated.
Terrestrial Ecology
Observing vegetation structure
X-band has shown the ability to measure canopy height and even structure. UAVSAR-Ka could possibly work comparably to X-band, opening the possibility of more compact radar/lidar implementations.
Applied Science
Observing small scale disturbances to road infrastructure, concrete structures, etc.
UAVSAR-Ka is more sensitive to really small scale surface roughness.
Technical Specs
| Frequency | 35,620–35,700 MHz |
| Nominal bandwidth | 80 MHz |
| Selectable bandwidths | 80 MHz |
| Polarization | Horizontal |
| Peak transmit power | 55 W |
| Maximum duty cycle | 10% |
| Look angle range | 15°–50° |
| Nominal range swath | 10 km |
| One-look slant range resolution | 1.8 m |
| One-look azimuth resolution | 0.25 m |
| Height precision (3x3 m posting) | 0.3–3 m |
Development
The airborne Glacier and Ice Surface Topography Interferometer's (GLISTIN-A) engineering upgrades were completed in 2012 to improve height accuracy.
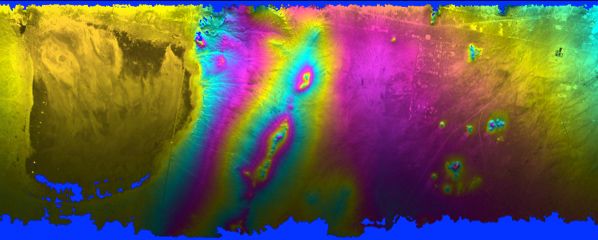
Results from August 6, 2012 GLISTIN-A engineering flight (ping-pong acquisition mode) over
Rosamond, CA. The color represents height and one color cycle corresponds to 100m.
The instrument was implemented by replacing UAVSAR's L-band antenna subsystem with Ka-band high power amplifier and RF electronics.
The Ka-band addition was originally funded by NASA's Advanced Instrument Technology Transition (AITT) program to generate high-precision, high resolution, large-swath digital surface models for ice surface topography mapping (Principal Investigator: Delwyn Moller of Remote Sensing Solutions).
Science demonstration flights began in 2013 over alpine glaciers and sea ice in Alaska, and floodplain in California. UAVSAR-Ka's applications have since expanded to other areas such as snow accumulation and volcano dynamics.